
TL;DR

Get business pricing on tech for your team
- Business-only prices and quantity discounts
- Tax-exempt purchasing
- Multiple users, one account, clear invoices
Researchers have developed the first detailed map tracking deaths along the US border’s ‘virtual’ barrier. This effort aims to improve understanding of migration-related fatalities and data gaps. The project is based on new data collection methods and analysis.
Researchers have produced the first comprehensive geographic map documenting deaths along the US-Mexico border’s ‘virtual wall,’ a significant step toward understanding migration-related fatalities and gaps in data collection. The project aims to provide detailed spatial insights into where migrants have died during attempts to cross the border, which has historically been difficult to quantify due to inconsistent reporting and data fragmentation.
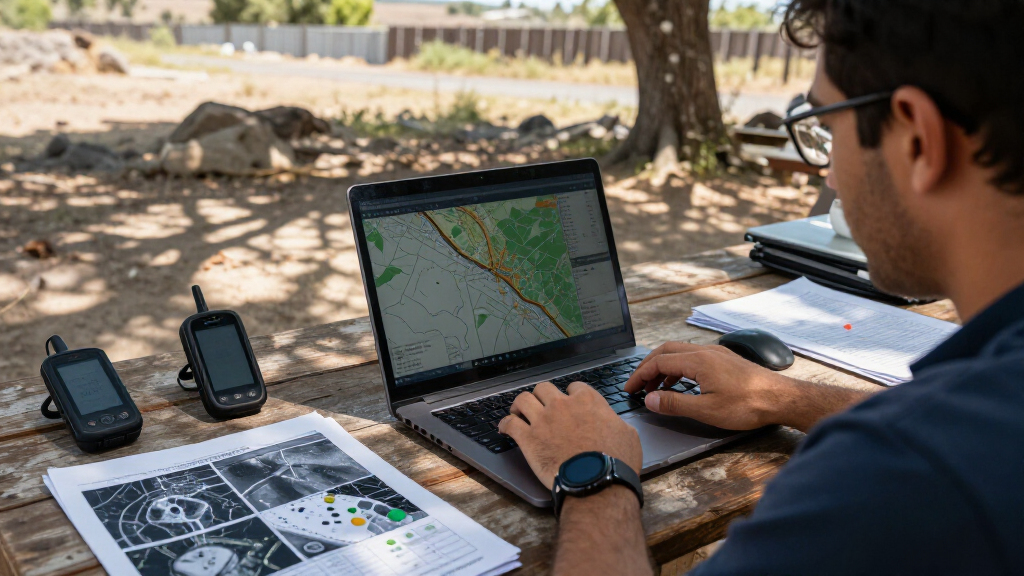
The map was developed by a team of researchers utilizing a combination of field data, forensic reports, and innovative data collection methods, including satellite imagery and local agency collaborations. It covers a broad timeframe, capturing known death sites from recent years and consolidating scattered information into a unified geographic database.
According to the research team, this is the first effort to visualize deaths along the entire length of the US border’s ‘virtual’ barrier, which refers to the increasingly complex and dispersed border enforcement infrastructure that extends beyond physical walls to include surveillance technology and remote monitoring systems. The map aims to fill critical gaps, as official data sources have historically underreported or misclassified border deaths.
While the project has been praised for its scope and detail, researchers caution that some data gaps remain due to inaccessible areas, unreported deaths, and inconsistent record-keeping by local authorities. The map is intended as a tool for policymakers, advocacy groups, and the public to better understand migration risks and advocate for improved safety measures.
Implications for Migration Safety and Policy
This new map provides concrete geographic evidence of the dangers migrants face along the US border, emphasizing the human toll of border enforcement policies. It offers a visual tool to identify high-risk zones and may influence policy discussions about border security, humanitarian aid, and search-and-rescue efforts. By highlighting data gaps, it also underscores the need for better reporting and coordination among agencies to prevent future fatalities.
As an affiliate, we earn on qualifying purchases.
Background on Border Death Data Collection Challenges
Efforts to document deaths along the US border have historically been fragmented and incomplete. Official records from agencies like Customs and Border Protection (CBP) often underreport fatalities or lack precise geographic data. Independent organizations, such as the Border Patrol Search, Trauma, and Rescue (BORSTAR), and forensic teams, have collected partial data, but no comprehensive geographic visualization has existed until now.
The term ‘virtual wall’ refers to the increasingly complex border enforcement landscape that extends beyond physical barriers to include surveillance towers, sensors, and remote monitoring systems. These technological layers complicate data collection and tracking, making it difficult to assess the full scope of migration-related deaths.
Recent interest in this issue has surged amid ongoing debates over border policies, humanitarian concerns, and the need for better data to inform decision-making. The development of this map responds to calls from advocacy groups and researchers for more transparent and complete information about migrant fatalities.
border surveillance camera systems
As an affiliate, we earn on qualifying purchases.
As an affiliate, we earn on qualifying purchases.
Data Completeness and Areas of Uncertainty
While the map is comprehensive, gaps remain due to inaccessible regions, unreported deaths, and inconsistent record-keeping by local authorities. Some remote areas lack sufficient data, and the true number of deaths may be higher than documented. Researchers acknowledge that certain zones along the border are underrepresented due to these limitations.
As an affiliate, we earn on qualifying purchases.
Next Steps for Data Improvement and Policy Use
The research team plans to collaborate with border agencies and advocacy groups to refine the map further, incorporating new data sources and expanding geographic coverage. They also aim to promote standardized reporting practices across jurisdictions. Policymakers and humanitarian organizations are expected to utilize the map to guide resource allocation, rescue operations, and policy reforms aimed at reducing border-related fatalities.
As an affiliate, we earn on qualifying purchases.
Key Questions
How was the map created?
The map was developed using a combination of field reports, forensic data, satellite imagery, and collaboration with local agencies to compile geographic information on known border deaths.
Why is this the first comprehensive map?
Previous efforts were fragmented, relying on partial data from various sources. This project consolidates and visualizes the data into a single geographic framework for the first time.
What data gaps still exist?
Some remote or inaccessible border areas lack sufficient data, and unreported deaths may still be missing from the map. Data collection remains challenging in certain regions.
How might this map influence border policies?
The map provides concrete evidence of migration risks, which could inform policies focused on humanitarian aid, rescue efforts, and border security reforms to reduce fatalities.
What are the limitations of the project?
The project depends on available data, which is incomplete in some regions. It also cannot account for all undocumented or unreported deaths, so actual figures may be higher.
Source: rss
Halloween Picks
halloween
As an affiliate, we earn on qualifying purchases.