To understand candlestick charts in crypto trading, you should look at each candlestick’s open, high, low, and close prices within a specific period, which shows you market trends and potential reversals. Watch for patterns like doji, hammer, or shooting star, and pay attention to volume spikes to confirm signals. Combining these elements helps you make better trading decisions. Keep exploring, and you’ll gain more insights into using candlestick patterns effectively.
Key Takeaways
- Understand candlestick components: open, high, low, and close prices, to interpret market sentiment.
- Recognize common patterns like doji, hammer, and shooting star for potential trend reversals.
- Combine volume analysis with candlestick formations to confirm the strength of price moves.
- Observe pattern developments such as flags or head and shoulders to predict continuations or reversals.
- Use surrounding price action and volume to validate breakouts and avoid false signals.
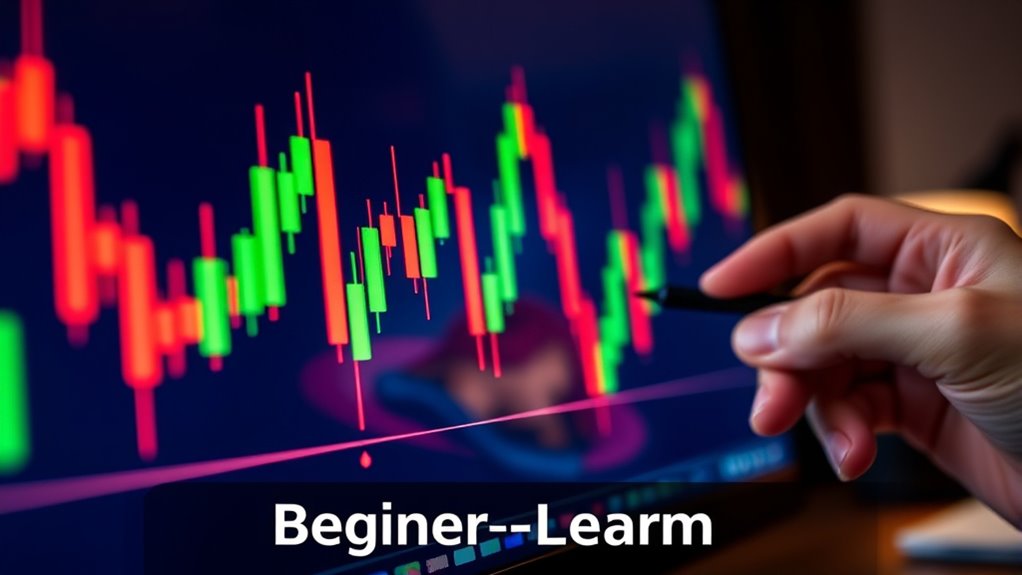
If you’re new to trading or investing, understanding candlestick charts is essential for analyzing price movements effectively. These charts provide a visual summary of how the price of an asset, like cryptocurrency, has changed over a specific period. Each candlestick displays four key data points: open, high, low, and close prices. By examining these, you can identify important price patterns that signal potential market directions. Recognizing these patterns helps you make more informed decisions and improves your overall trading strategy. Additionally, understanding the role of contrast ratio in visual clarity can help you better interpret chart details and improve your analysis. Volume analysis plays a vital role alongside candlestick patterns. When you see a candlestick forming on high volume, it often indicates strong market interest and can confirm the validity of the price move. Conversely, a candlestick on low volume might suggest a lack of conviction, signaling that the move could be a false breakout or temporary fluctuation. Combining candlestick analysis with volume insights allows you to determine whether a trend is gaining momentum or fading. For example, a bullish engulfing pattern accompanied by rising volume could point to a potential upward breakout, giving you a clearer signal to buy or hold. Pay attention to specific candlestick formations that frequently appear in crypto markets. Doji candles, with their small bodies, suggest indecision among traders, which may precede a trend reversal. Hammer and shooting star patterns provide clues about potential reversals after strong moves. When you spot these formations, check the surrounding price action and volume to confirm their significance. For instance, a hammer with increased volume after a downtrend might signal a bullish reversal, prompting you to consider entering a long position. It’s also helpful to familiarize yourself with common price patterns, such as flags, pennants, and head and shoulders. These patterns often develop over multiple candles and can indicate continuation or reversal of a trend. When analyzing these formations, look for volume spikes that reinforce the pattern’s reliability. A breakout from a pattern on higher-than-average volume suggests that the move has strong backing and is more likely to sustain. Conversely, a breakout on low volume can be a warning sign of a false move.
![X14 Drawing Tablet • PicassoTab Largest 14" Screen, Included Learning Package [Premium Drawing Apps & Tutorials] Stylus Pen, No Computer Needed, Standalone Graphics Tablet for Digital Artists -PX14](https://m.media-amazon.com/images/I/41wKxhGpMoL._SL500_.jpg)
X14 Drawing Tablet • PicassoTab Largest 14" Screen, Included Learning Package [Premium Drawing Apps & Tutorials] Stylus Pen, No Computer Needed, Standalone Graphics Tablet for Digital Artists -PX14
LARGEST PORTABLE DRAWING TABLET: Experience the X14, the ultimate drawing tablet with its impressive 14.1-inch Full HD screen....
As an affiliate, we earn on qualifying purchases.
Frequently Asked Questions
How Do I Identify Potential Trend Reversals Using Candlestick Patterns?
To identify potential trend reversals, look for key candlestick patterns like doji, hammer, or shooting star, which signal reversal confirmation. Pay attention to pattern reliability—wait for these patterns to appear after a clear trend and confirm with volume or other indicators. When you see a strong pattern combined with confirmation signals, it indicates a high likelihood of a trend reversal, helping you make more informed trading decisions.
What Are the Most Reliable Candlestick Patterns for Crypto Trading?
Did you know that candlestick patterns have an 80% success rate in predicting reversals? The most reliable patterns include reversal signals like hammer and shooting star, which indicate potential trend changes, and continuation patterns like flags and pennants, signaling ongoing momentum. Recognizing these patterns helps you make smarter trades, as they give clear signals about when a trend might reverse or continue, enhancing your overall trading strategy.
How Do Timeframes Affect Candlestick Chart Readings?
Timeframes substantially impact your candlestick chart readings because they determine the chart resolution and how much detail you see. Shorter timeframes, like 1-minute or 5-minute, show quick price movements and are great for active trading. Longer timeframes, such as daily or weekly, reveal broader trends. Choosing the right timeframe helps you interpret market sentiment accurately, giving you better insights into potential entry and exit points.
Can Candlestick Patterns Predict Future Price Movements Accurately?
Candlestick patterns act like a weather vane, hinting at market psychology, but they don’t guarantee future moves. While some patterns, like doji or hammer, are reliable indicators, others can be misleading. You should see them as part of the bigger picture, not crystal balls. Always combine pattern recognition with volume and trend analysis for better accuracy, knowing that no pattern can predict market movements with 100% certainty.
How Do Volume and Candlestick Patterns Work Together?
You can improve pattern reliability by combining volume confirmation with candlestick patterns. When a pattern forms alongside increased volume, it signals stronger trader interest, making the pattern more trustworthy. For example, a bullish reversal with high volume suggests a higher chance of a price upward move. Always look for volume confirmation to validate candlestick signals, helping you make more informed trading decisions and reducing false signals.
HUION KAMVAS Pro 16 Drawing Tablet with Screen, 15.6 inch Pen Display Anti-Glare Glass 6 Shortcut Keys Adjustable Stand, Graphics Tablet for Drawing, Writing, Design, Work with Windows, Mac and Linux
[Outstanding Visuals] You can enjoy immersive viewing in great clarity and fine detail with the help of 15.6-inch...
As an affiliate, we earn on qualifying purchases.
Conclusion
By mastering candlestick charts, you gain a powerful tool to interpret market trends and make smarter trading decisions. Did you know that studies show traders who understand technical analysis are 60% more likely to identify profitable opportunities? Keep practicing, stay patient, and don’t rush your learning journey. With consistent effort, you’ll soon see patterns that reveal market sentiment, helping you become a more confident and successful crypto trader.

XPPen Updated Deco 01 V3 Drawing Tablet-16384 Levels of Pressure Battery-Free Stylus, 10x6 Inch OSU Graphic Tablet, 8 Hotkeys for Digital Art, Teaching, Gaming Drawing Pad for Chrome, PC, Mac, Android
Word-first 16K Pressure Levels: The upgraded stylus features 16,384 levels of pressure sensitivity and supports up to 60...
As an affiliate, we earn on qualifying purchases.
HUION Kamvas 22 Plus QLED Drawing Tablet with Full-Laminated Screen USB-C Connection 140% sRGB Tilt, 21.5 inch Graphics Art Tablet for Artist & Designer, Work with Mac, Windows, Linux & Android Black
Please note: Kamvas 22 Plus Pen Display is not a standalone product, this device must be connected to...
As an affiliate, we earn on qualifying purchases.