📊 Full opportunity report: Bitcoin Battles Unfold in Live Warzone Visualization on ThorstenMeyerAI.com — validation score, market gap, and execution plan.
TL;DR
A groundbreaking web project visualizes live Bitcoin trading as a dynamic war scene, connecting directly to Binance and Coinbase streams. It offers an immersive, real-time display of market activity, emphasizing chaos and conflict without providing trading guidance.
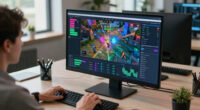
The Bitcoin War visualization has been officially launched, offering a real-time, cinematic depiction of Bitcoin trading activity. Developed by isbitcoindead.com, this tool transforms live BTC/USDT trades into a dynamic battlefield, illustrating the ongoing tug-of-war between buyers and sellers. The project is accessible for free in any modern browser, making it a novel way to experience market volatility visually and viscerally.
The visualization connects directly to the public Binance trade stream via WebSocket, with an automatic fallback to Coinbase, ensuring continuous data flow. It visualizes each market tick as a combatant—buy orders from the Cobalt Host push the front line from the left, while sell orders from the Ember Legion counter from the right. Large liquidations are depicted as airstrikes, adding a visceral element to the display.
This project leverages browser-native technology, including Canvas 2D graphics, WebAudio synthesis, and real-time stream processing, all without backend infrastructure. The system features an automatic camera that shifts perspectives, a live DEFCON meter indicating market volatility, and a scrolling war log narrating ongoing activity. A synthetic soundtrack generated within the browser heightens the tension, while a comprehensive scoreboard tracks market metrics like seconds won, casualties, and dollar gains or losses, creating a compelling visual story of market dynamics.
Importantly, the developers specify that Bitcoin War is not a trading tool. It does not involve wallets, signals, or investment advice. Instead, it aims to provide an artistic, data-driven visualization of market chaos, emphasizing the raw, unfiltered activity of Bitcoin trading as a cinematic battlefield.
Implications of Visualizing Market Chaos as Warfare
This visualization offers a new perspective on market volatility, turning complex trading data into an accessible, visceral experience. It demonstrates how advanced web technologies can be harnessed for creative data representation, making market dynamics more tangible for viewers. While it does not provide trading guidance, it highlights the intense, often chaotic nature of Bitcoin trading, which could influence how traders and observers perceive market activity and volatility.

Bitcoin Merch Gold Nugget Lottery Miner, WiFi-Enabled Bitcoin Solo Miner, 377 KH/s Hashrate, Ultra-Low Power Consumption, Compact Design
- Mining Type: Solo Bitcoin mining device
- Connectivity: WiFi-enabled for easy setup
- Hashrate: 377 KH/s optimized performance
As an affiliate, we earn on qualifying purchases.
As an affiliate, we earn on qualifying purchases.
Background of Market Visualization Projects
Recent years have seen increasing interest in visual data representations of financial markets, often aiming to make complex trading activity more understandable. The Bitcoin War project builds on this trend by providing a cinematic, real-time depiction of market battles, inspired by the chaos of Bitcoin trading. It utilizes cutting-edge browser tech, showcasing the potential for immersive, accessible visualizations without heavy infrastructure. The project is part of a broader movement toward artistic and educational tools that depict financial data in innovative ways.
“This project exemplifies how web technology can turn raw market data into an engaging visual narrative, emphasizing the chaos inherent in trading.”
— an anonymous researcher
cryptocurrency market data display
As an affiliate, we earn on qualifying purchases.
As an affiliate, we earn on qualifying purchases.
Unconfirmed Aspects and Limitations of the Visualization
It is not yet clear how accurately the visualization reflects actual market conditions or whether it influences trader behavior. The project explicitly states it is not a trading tool, but the visceral depiction may lead to misinterpretation among viewers. Additionally, the impact of the visualization on market perception or trading decisions remains unstudied. The long-term stability of the data streams and potential technical issues during high volatility periods are also still being evaluated.
As an affiliate, we earn on qualifying purchases.
Future Developments and Potential Expansions
Developers plan to continue refining the visualization, possibly adding more detailed analytics or interactive elements. They may also explore integrating other market data streams or expanding the concept to include other cryptocurrencies. Monitoring user feedback and observing the visualization’s influence on public perception of market volatility will likely guide future updates. The project is positioned as an artistic experiment, with no current plans for commercial or trading applications.
As an affiliate, we earn on qualifying purchases.
Key Questions
Is Bitcoin War a trading platform?
No, Bitcoin War is not a trading platform. It does not involve wallets, signals, or investment advice. Its purpose is purely artistic and educational, providing a visual representation of market activity.
How does the visualization work technically?
The project uses browser-native technologies, including Canvas 2D graphics, WebAudio synthesis, and real-time WebSocket streams from Binance and Coinbase, to create an immersive visual experience without backend infrastructure.
Can I influence the visualization or customize it?
Currently, the visualization is automated and not designed for user customization. Future updates may include more interactive features, but the current version is a passive, cinematic display.
Does this visualization affect market behavior?
There is no evidence to suggest it influences actual trading behavior. It is intended as an artistic depiction, not a trading aid.
Is the visualization available for free?
Yes, the visualization is available free of charge and can be accessed instantly via any modern browser at war.isbitcoindead.com.
Source: ThorstenMeyerAI.com