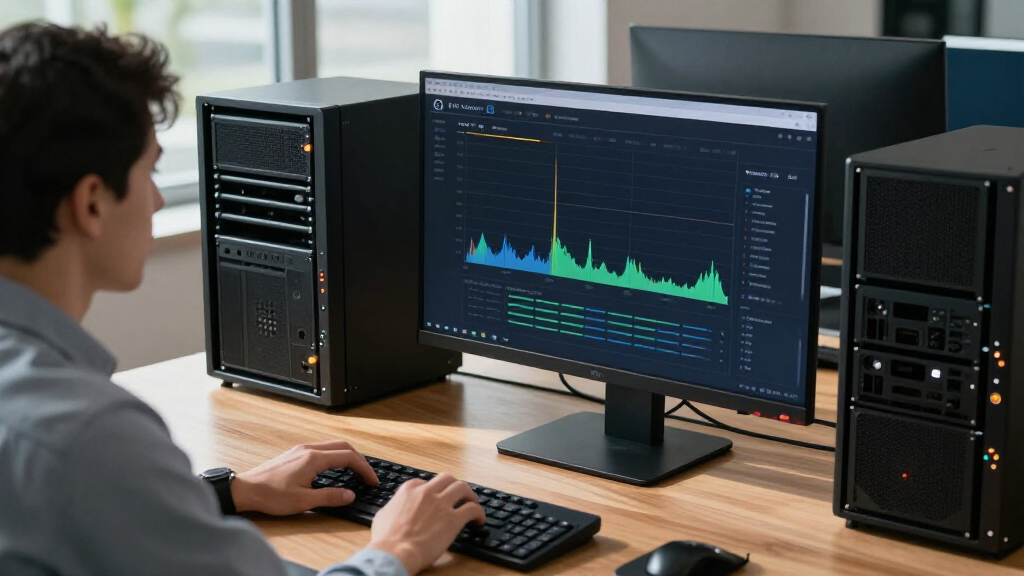

🔍 Read the full analysis: A Guide To System-Level Profiling For TorchNeuron On AWS Trainium on ThorstenMeyerAI.com

Get business pricing on tech for your team
- Business-only prices and quantity discounts
- Tax-exempt purchasing
- Multiple users, one account, clear invoices
TL;DR
Hugging Face has published a first TorchNeuron profiling tutorial that demonstrates capturing CPU, runtime and device traces while measuring RMSNorm inference on AWS Trainium. It compares a basic PyTorch implementation, a built-in fused operation and a compiled version, but the supplied material includes no timing results or performance winner.
Hugging Face has published Part 1 of a TorchNeuron profiling tutorial showing how to trace RMSNorm inference from PyTorch through the Neuron runtime to AWS Trainium hardware. The guide sets out a method for comparing three implementations of the operation, but the supplied source does not include measurements or identify a fastest version.
The walkthrough uses TorchNeuron, an open-source PyTorch backend for Trainium, with PyTorch’s profiler and Neuron profiling tools. It shows how to configure NeuronConfig to select data streams, NeuronCores and an output directory, then pass that configuration into the profiler. The guide also uses NeuronProfiler to export a framework trace alongside Neuron system traces.
The examples enable CPU and PrivateUse1 activities, allowing framework-side work to be viewed alongside accelerator activity. The guide says to synchronize the device inside the profiling loop before advancing each profiler step. Without that synchronization, its instructions warn, the profiler’s Neuron time column may be empty. The example schedule waits for two steps, warms up for one, and records one active step over four calls.
The comparison covers three ways to run RMSNorm: a sequence of basic PyTorch operations, the built-in torch.rms_norm() lowered to a fused Neuron kernel, and the basic version compiled with torch.compile. The source says the versions use the same inputs, profiler configuration and schedule. It points readers to TorchNeuron example scripts for reproduction and Neuron Explorer for examining the exported traces.
Tracing the Full Inference Path
The tutorial addresses a practical problem for teams running machine-learning inference: a slow operation’s total runtime does not, by itself, reveal where time is being spent. A profiler table can report Self CPU time and Neuron device time, while a system trace can show an operation moving from framework dispatch through runtime scheduling to execution on a NeuronCore.
Those views can help practitioners investigate whether a delay appears in framework work, runtime handling or device execution. That distinction matters when deciding whether to change model code, examine accelerator scheduling, or test a different implementation. The tutorial provides a way to make those comparisons; it does not establish that any one implementation improves performance.
For teams evaluating Trainium, the method may offer more diagnostic detail than timing a model call alone. Its practical value will depend on how well the trace information carries over to each team’s model, workload and input shapes.
Products Worth Considering

Logitech MX Keys S Combo Wireless Keyboard and Mouse, Graphite

Amazon Kindle Paperwhite (12th Generation, 2024), 16GB, 7-Inch Display, Raspberry

Apple Watch Series 8 GPS 41mm Midnight Aluminum Case with Midnight Sport Band
As an affiliate, we earn on qualifying purchases.
A Small Operation as a Test Case
The guide uses RMSNorm as a focused example. In the basic implementation, the input is squared, the mean of the squared values is calculated, epsilon is added, and a reciprocal square root is applied before scaling by the input and a weight. The example runs a 4-by-512 bfloat16 input on a Neuron device.
TorchNeuron supports standard PyTorch workflows, including eager execution and torch.compile, according to the tutorial. It also connects with the Neuron Kernel Interface for custom operators. The guide explains that Neuron registers with PyTorch through its PrivateUse1 extension point, which lets an accelerator backend integrate without a dedicated dispatch key such as CUDA’s.
For trace inspection, the guide identifies Neuron Explorer as a browser-based tool for viewing system traces, device timelines and per-engine activity. It says a complete output directory can be opened for a system or combined profile; device-only inspection uses matching NEFF and NTFF files. The source describes NEFF as the compiled executable and NTFF as its hardware instruction trace.
“How to follow one operation through Neuron Explorer, from framework dispatch through runtime scheduling to hardware execution on a NeuronCore.”
— Hugging Face tutorial
Performance Findings Are Missing
The supplied source describes the profiling workflow but ends before reporting the profiler table, trace findings or timing measurements. It does not say whether the basic, fused or compiled RMSNorm version uses less CPU or device time. No performance winner can be inferred from the method alone.
The example’s results, if available elsewhere, would also be tied to its input shape, data type, profiling setup and device. The source provides no evidence that a result from this small test would apply to different models, batch sizes or workloads. It gives no publication date and does not say when another part of the series will appear.
Inspect and Compare the Traces
The next steps described in the walkthrough are to inspect the exported profiler table and trace, then repeat the process for the fused and compiled RMSNorm versions. Readers can use the linked example scripts to reproduce the setup and Neuron Explorer to examine runtime and device activity.
Whether Hugging Face will publish measured comparisons or a follow-up tutorial is not specified in the supplied material. Until results are reported, the guide should be read as instructions for conducting a comparison, not as evidence about which implementation performs best.
Key Questions
What does the Hugging Face tutorial cover?
It explains how to profile RMSNorm inference with TorchNeuron on AWS Trainium, capturing information from PyTorch, the Neuron runtime and the device.
Which RMSNorm implementations does it compare?
The tutorial sets up a comparison of a basic PyTorch operation sequence, the built-in torch.rms_norm() lowered to a fused Neuron kernel, and the basic version compiled with torch.compile.
Does the source say which implementation is fastest?
No. The supplied material does not include timing measurements or profiler results, so it does not establish a performance winner.
Why does the guide synchronize the Neuron device?
The instructions say to call torch.neuron.synchronize() in the profiling loop so device work finishes before the profiler advances. Without synchronization, the Neuron time column may be empty.
Can the example’s results be applied to other models?
Not on the evidence supplied. The example uses a 4-by-512 bfloat16 input; the source does not show that any result generalizes to other shapes, models or workloads.
Primary source: Hugging Face · via ThorstenMeyerAI.com