
📊 Full opportunity report: Bitcoin Battles Unfold in Live Warzone Visualization on ThorstenMeyerAI.com — validation score, market gap, and execution plan.
Listen free for 30 days with Audible
Thousands of audiobooks and originals — cancel anytime.
Start your free trialAs an affiliate, we earn on qualifying purchases.
TL;DR
A groundbreaking web project visualizes Bitcoin trading as a live battlefield, illustrating the ongoing tug-of-war between buyers and sellers. The tool offers an immersive, real-time view of market activity without trading functions. The development showcases advanced browser tech and provides a visceral perspective on market dynamics.
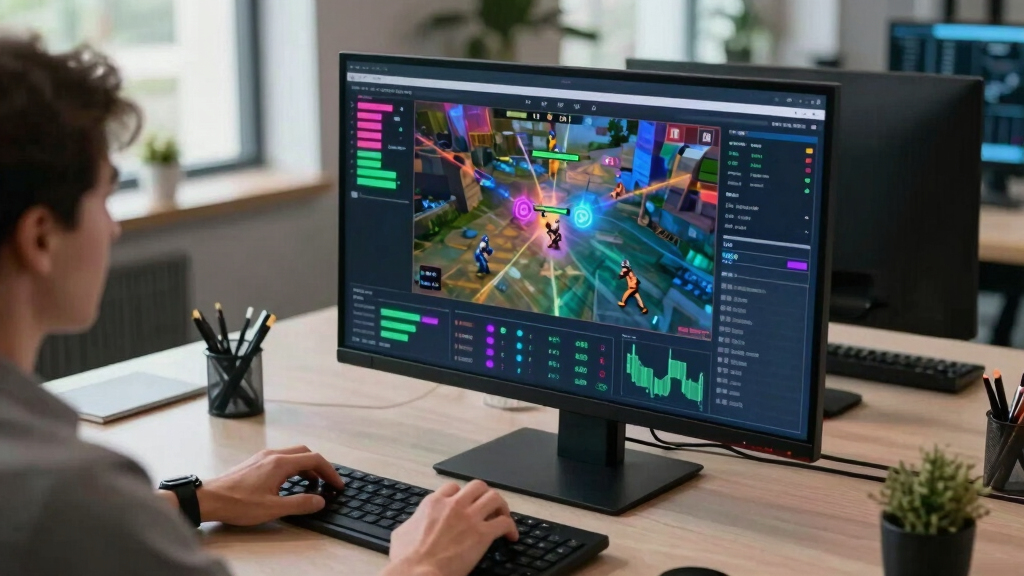
isbitcoindead.com has released a live, cinematic visualization of Bitcoin trading activity, transforming real-time BTC/USDT trades into a dynamic battlefield scene. The project provides an immersive view of market dynamics by depicting buyers and sellers as combatants in an ongoing war, accessible directly through any modern browser. This innovative tool aims to offer viewers a visceral understanding of market volatility without any trading functionalities.
The visualization connects directly to the public Binance trade stream via WebSocket, with a fallback to Coinbase, ensuring continuous data flow. Each trade is visualized as a combatant: buy orders from the Cobalt Host push the front line from the left, while sell orders from the Ember Legion counter from the right. Large liquidations are represented as airstrikes, adding a visceral element to the scene. The entire setup is built using browser-native technologies such as Canvas 2D graphics, WebAudio, and real-time stream processing, with no backend infrastructure involved.
Engineered to be lightweight—roughly 180KB—the system offers a seamless experience, including an automatic camera that shifts perspectives, a live DEFCON meter indicating market volatility, and a scrolling war log narrating ongoing activity. A synthetic soundtrack generated within the browser amplifies the tension, while a comprehensive scoreboard tracks market metrics like seconds won, casualties, and dollar gains. Importantly, the project is purely artistic and data-driven, explicitly stating it is not a trading tool and does not involve wallets, signals, or advice.
Why the Bitcoin War Visualization Matters
This project demonstrates the potential of advanced web technologies to create immersive data visualizations that are accessible and engaging. It offers a novel way to observe and interpret market activity, making the chaos of trading more tangible through cinematic storytelling. While not a trading tool, it highlights how creative applications of real-time data can enhance understanding of market volatility and dynamics, especially for tech enthusiasts and educators.
The visualization also underscores the increasing role of browser-based technology in delivering complex, real-time experiences without heavy infrastructure, paving the way for more innovative data representations in finance and beyond.
Bitcoin trading visualization software
As an affiliate, we earn on qualifying purchases.
As an affiliate, we earn on qualifying purchases.
Background and Development of the Bitcoin War Visualizer
The project was developed by isbitcoindead.com as an artistic exploration of Bitcoin market activity, leveraging publicly available trade streams from Binance and Coinbase. It builds on the trend of using visual storytelling to interpret financial data, combining real-time streaming with cinematic effects. The visualization launched in early April 2024 and quickly gained attention for its innovative approach to depicting market chaos as a battlefield scene.
Previous efforts in market visualization have focused on charts and dashboards, but this project takes a different approach by transforming raw data into a visceral, cinematic experience, emphasizing the ongoing contest between buyers and sellers without offering trading advice or signals.
“This visualization provides a visceral, real-time glimpse into the chaos of Bitcoin trading, making market dynamics more tangible than traditional charts.”
— an anonymous researcher
cryptocurrency market analysis tools
As an affiliate, we earn on qualifying purchases.
As an affiliate, we earn on qualifying purchases.
Unconfirmed Aspects and Technical Limitations
It is not yet clear how widely adopted or used the visualization will become beyond initial public access. The project is primarily artistic and educational, and there is no indication it will evolve into a trading tool or platform. Details about future updates, potential integrations, or broader applications remain undisclosed. Additionally, while the system is designed for continuous operation, its performance under high market volatility or technical issues has not been publicly tested or confirmed.
As an affiliate, we earn on qualifying purchases.
Future Development and Potential Uses of the Visualization
The developers may expand the project with additional features, such as more detailed analytics or interactive elements. There is also potential for educational institutions or media outlets to incorporate the visualization for market analysis or storytelling. Monitoring user engagement and feedback will likely influence future updates. No official plans for commercialization or integration into trading platforms have been announced.
As an affiliate, we earn on qualifying purchases.
Key Questions
Is the Bitcoin War visualization a trading tool?
No, it is purely an artistic and data visualization project. It does not involve trading, wallets, or signals.
How does the visualization work technically?
It connects directly to public Binance and Coinbase trade streams via WebSocket, rendering trades as combat units using browser-native Canvas 2D graphics, WebAudio, and real-time processing.
Can I customize or interact with the visualization?
Currently, the visualization is a fixed, cinematic display with automatic camera shifts and no user interaction features.
Will this visualization be useful for traders?
Not directly. It is designed as an artistic, educational depiction of market activity, not a trading or analysis tool.
Where can I see the visualization?
You can view it at war.isbitcoindead.com.
Source: ThorstenMeyerAI.com
Flea & tick season Picks
flea and tick prevention
As an affiliate, we earn on qualifying purchases.